
Fig. 5.
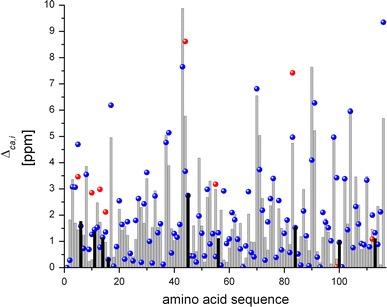
Histogram of Δca,i values. For the published NAB ensemble of 20 NMR conformers (Serrano et al. 2009) the values calculated with correction for the proline effect are indicated by blue dots. For the NAB-13Cα ensemble the data calculated with correction for the proline effect are given by the height of the grey bars, and those calculated without correction for the proline effect by red dots (indicated only for the 9 residues preceding Pro. The Pro positions are indicated by black bars)