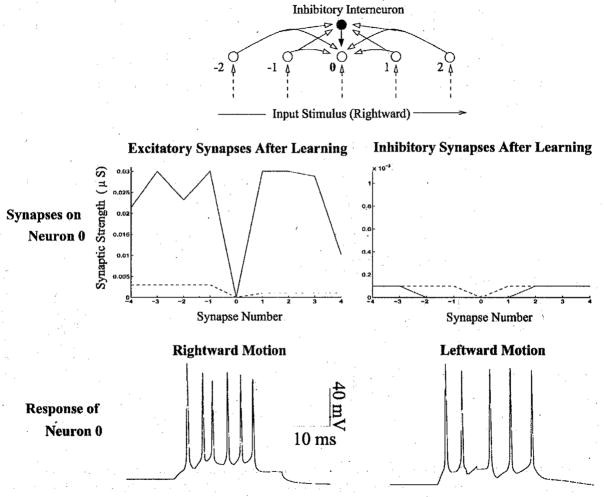
Fig 4.
The Effect of Rate-Based Hebbian Learning. The same network as in Fig 3, with identical initial conditions and input stimuli, was used to test the effects of rate-based learning. The top panel depicts the recurrent connections to a given neuron (labeled ‘0’) in the two-chain network. The GABAergic interneuron is represented by the darkened circle. The middle panel represents the changes in synaptic strength as a result of rate-based Hebbian learning, which relies on correlations in pre- and postsynaptic spikes irrespective of their temporal order. Despite an initial asymmetry in the excitatory connections (dotted lines), ratebased Hebbian learning resulted in an approximately symmetric pattern of connections. As a result, the neurons in the two-chain network fail to exhibit direction selective responses (bottom panel).

