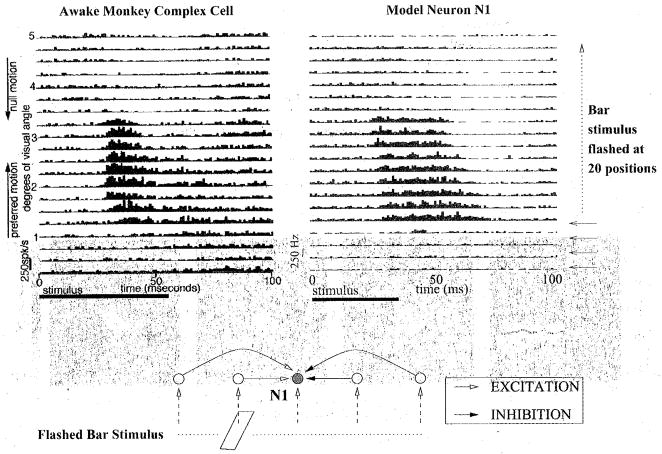
Fig 6.
Comparison of Monkey and Model Space-Time Response Plots to Single Flashed Bars. (Top, Left) Sequence of PSTHs obtained by flashing optimally oriented bars at 20 positions across the 5°-wide receptive field (RF) of a complex cell in alert monkey V1 (from [18]). The cell’s preferred direction is from the part of the RF represented at the bottom towards the top. Flash duration = 56 ms; inter-stimulus delay = 100 ms; 75 stimulus presentations. (Top, Right) PSTHs obtained’ from a model neuron after stimulating the chain of neurons at 20 positions to the left and right side of the given neuron. The lower PSTHs represent stimulations on the preferred side while upper PSTHs represent stimulations on the null side. (Bottom pane1) Interpretation of the space-time plots in the model. Bars flashed on the left (preferred) side of the recorded cell (shaded) cause progressively greater excitation as the stimulation site approaches the recorded cell’s location. Bars flashed to the right of the cell cause inhibition due to the predominantly inhibitory connections that develop on the right (null) side during learning.

