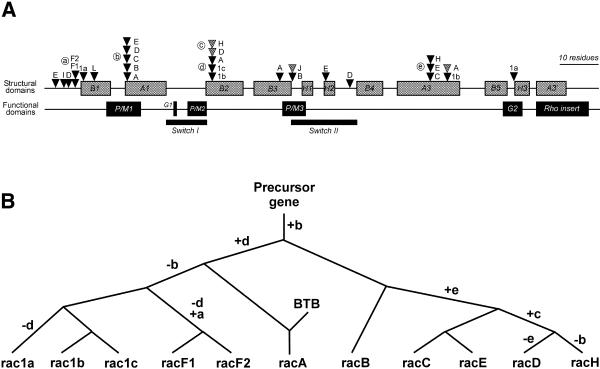
Figure 7.
Analysis of intron positions in Dictyostelium rac genes. (A) Locations of introns relative to regions encoding structural and functional elements in the rac genes. Only introns placed in coding regions are shown. There are no introns beyond helix H3. Positions of introns are depicted as triangles. Introns residing in the same codon but at different locations are discriminated by their shading. Positions shared by two or more genes have been labelled with circled letters. (B) Evolutionary relationships among some Dictyostelium rac genes. The tree is based on the analysis of shared intron positions combined with analyses of protein sequences. Nodes represent duplication events or, for racA, fusion with the BTB domain-containing C-terminal moiety. Letters at the branches denote acquired (+) or lost (–) introns. The nomenclature for the intron positions is as in (A). Branch lengths are not proportional to evolutionary distance. The Dictyostelium rac family probably arose by a complex process of duplications and acquisition and loss of introns.

