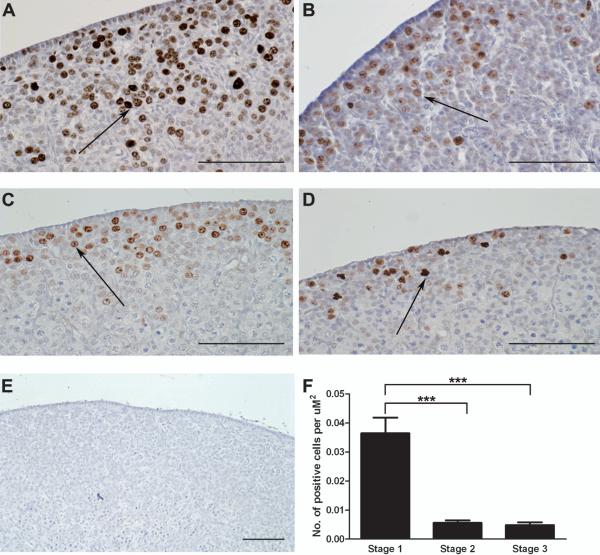
Figure 2.
Localisation of proliferating cells throughout sheep gestation using Ki67 as a marker. A, Light field-microscopy revealed intense brown DAB staining for Ki67 in the germ cells of Day 50 (Stage 1) ovaries. As gestational age increases there was a reduction in positive brown DAB staining. Decreased Ki67 expression was observed in the germ cells of Stage 2 (B and C) and Stage 3 (D) ovaries. Arrows are pointing at oocytes showing positive brown DAB staining. E, No DAB staining was observed in the negative control section. All the scale bars represent 100 μm. F, To quantify the results, the total number of Ki67 positive cells was counted over 8-12 fields for each ovary. This number was divided by the total area of 8-12 fields (2000-3000 μm2) to give the number of cells per μm2 for each ovary. For this experiment three Stage 1; eight Stage 2 and four Stage 3 ovaries were examined for Ki67 staining. Values are the mean for each group ± SEM. Ki67 expression changed significantly across gestation (P<0.0001, Kruskal-Wallis). There was a significant reduction in the number of Ki67 positive cells at Stage 2 and Stage 3 of gestation compared to Stage 1 (P<0.0001, Dunn).

