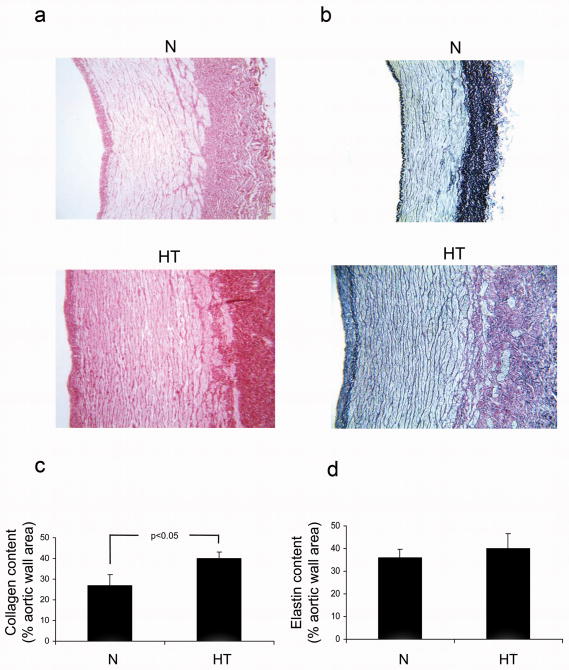
Figure 2.
Assessment of collagen and elastin content in the aortic wall of control (N) and hypertensive (HT) aortas. a: Sirius Red staining demonstrates dense collagen deposition in the adventitia in HT and especially at the junction to the media. Magnification is 10×. b: Elastica-van -Gieson staining elastin fibers within the aortic wall. Magnification is 10×. c: Quantification of the Sirius Red shows increased collagen density within the hypertensive aortas. d: Quantification of the elastin staining shows no difference between normal and hypertensive aortas. Statistical comparison performed with Student's t-test with p<0.05 being significant.

