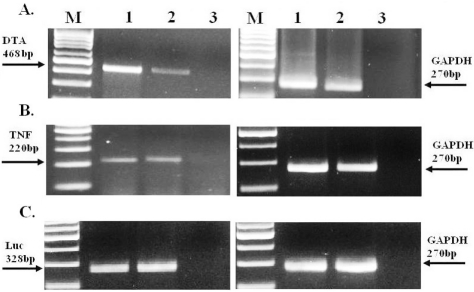
Figure 6.
The relative RNA level of DTA, TNF and Luciferase after treatment of SK-OV3 subcutaneous tumors with pH19-DTA, pH19 -TNF-α, pH19-TNF-IRES-DTA or pH19-Luc plasmids determined by RT-PCR. 48h after the animals were treated with the plasmid; samples from the ovarian cancer subcutaneous tumors were excised and frozen immediately. 400 ng RNA from the tumors were used for the determination of DTA, TNF and Luc by RT-PCR reactions. A. Lane 1: DTA transcripts 48h after pH19-DTA plasmid injection, Lane 2: DTA transcripts 48h after pH19-TNF- IRES -DTA plasmid injection. B. Lane 1: TNF transcripts 48h after pH19-TNF plasmid injection, Lane 2: TNF transcripts 48h after pH19-TNF- IRES-DTA plasmid injection. C. Lane1-2: Luc transcripts 48h after pH19-Luc plasmid injection. The sizes of the PCR products are 468, 220, 328 and 270 bp for DTA, TNF, Luc and GAPDH internal control respectively. M-100 bp molecular weight marker.

