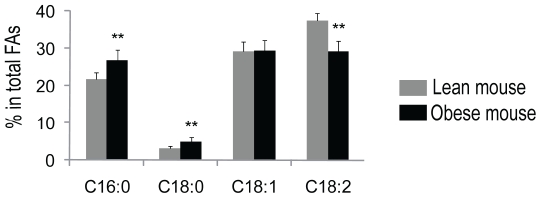
Figure 1.
Fatty acid composition in adipose tissue—obese mice versus lean mice. Mice epididymal adipose tissues were extracted with chloroform (containing 100 μg BHT/ml), followed by methylesterification of total fatty acids with BF3/Methanol. Analysis of fatty acids was performed using a gas chromatography system, and heptadecanoic acid (17:0) was used as an internal standard for data analysis. Adipose tissues of obese mice have increased saturated fatty acids and decreased unsaturated fatty acids. Dark bars are representative of obese mice, and light bars represent lean mice. n = 10. Data are expressed as means ± SD. **P < 0.01 versus lean mice.

