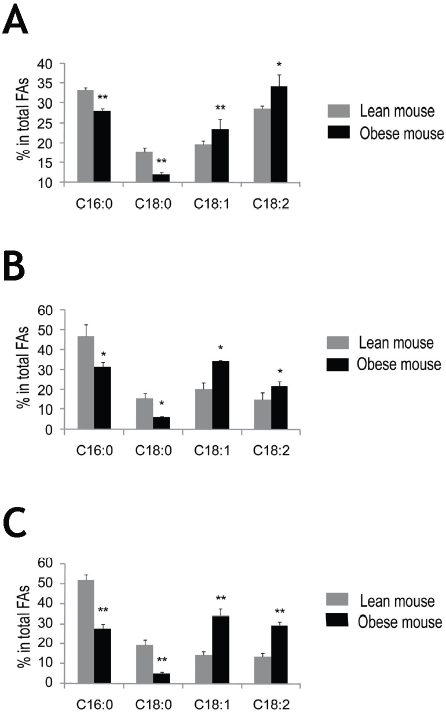
Figure 2.
Fatty acid composition in liver, spleen and pancreas—obese mice versus lean mice. The liver, spleen and pancreas tissues were homogenized in MBST/OG buffer and extracted with Folch/BHT reagent, followed by methyl esterification of total fatty acids with BF3/Methanol. Analysis of fatty acids was performed using a gas chromatography system, and heptadecanoic acid (17:0) was used as an internal standard for data analysis. Obese mice exhibit reduced saturated fatty acids and increased unsatu-rated fatty acids distribution in the liver (A), spleen (B) and pancreas (C). Dark bars represent obese mice, and light bars represent lean mice. n = 4. Data are expressed as means ± SD. *P < 0.05, **P < 0.01 versus lean mice.

