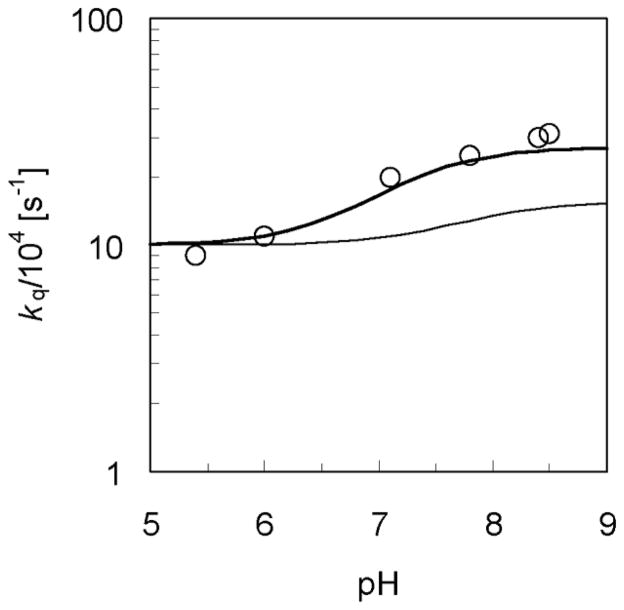
Figure 2.
pH-dependence of the overall rate constant kq for the rhenium-tyrosine complex in H2O and D2O. The experimental data for kq measured with 10mM phosphate buffer in H2O (Figure 3 in Ref. [14]) are depicted with open circles (○). The rate constants for the phosphate-acceptor model with 10mM phosphate buffer calculated using Eq. (14) are depicted with thick and thin lines for the reaction in H2O and D2O, respectively. The rate constant for the reaction in H2O or D2O is plotted as a function of pH or pD, respectively, where the mole fraction or is calculated as a function of pH or pD using Eq. (15) with pKa = 7.2 or 7.8, respectively. Figure reproduced with permission from Ref. [37].

