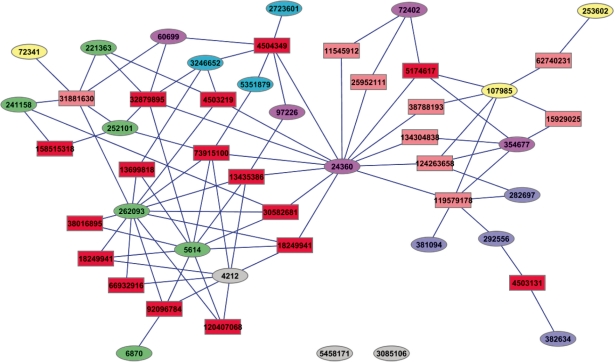
Fig. 4.
The complete diagram of the compound–target interaction network for the 24 compounds identified from the six clusters (i.e. A to F) obtained by hierarchical clustering. Compounds are denoted as ellipses, which are labeled with PubChem compound identifier (CID) and colored according to the clusters they belong to. Targets are denoted as rectangles, which are labeled with NCBI protein identifier (GI) and colored with dark or light red if the corresponding assay is a confirmatory or primary bioassay in PubChem, respectively. The edge linking an ellipse and a rectangle indicates that there is an interaction if the current compound is found active against the target of interest. No edge is allowed between either two ellipses or two rectangles. For simplicity, target nodes that have only single connecting compound node are not shown.

