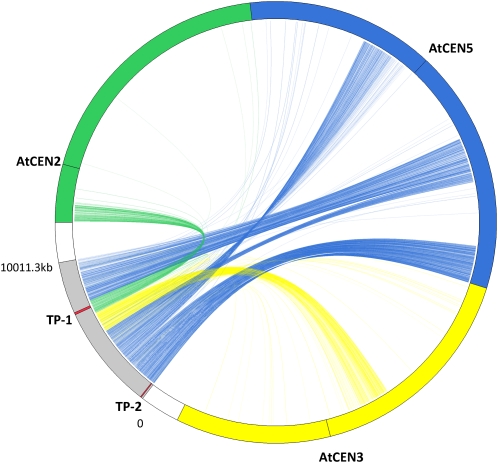
Figure 1.
Synteny between a T. parvula scaffold and Arabidopsis chromosomes. A Circos plot depicting the T. parvula scaffold 00254 (gray) and Arabidopsis chromosomes 2 (green), 3 (yellow), and 5 (blue) is shown. The predicted T. parvula ORFs were connected to their putative Arabidopsis homologs, with the color of the connecting line designating the Arabidopsis chromosome, to visualize the synteny between two species. The two regions, TP-1 and TP-2, where the genomic sequences were available for three-species comparison are designated with red bands.

