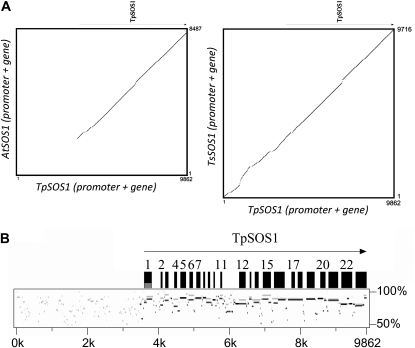
Figure 3.
Comparison of the SOS1 omologs in T. parvula, T. salsuginea, and Arabidopsis. The genomic sequence spanning the 5′ intergenic space and SOS1 genes from T. parvula was compared with the corresponding regions in T. salsuginea and Arabidopsis using dot plot (A) and PipMaker plot (B). In B, the PipMaker plots comparing TpSOS1 with TsSOS1 (gray) and AtSOS1 (black) were superimposed to show the differences in similarity. Word size of the PipMaker plot was 7 bp.

