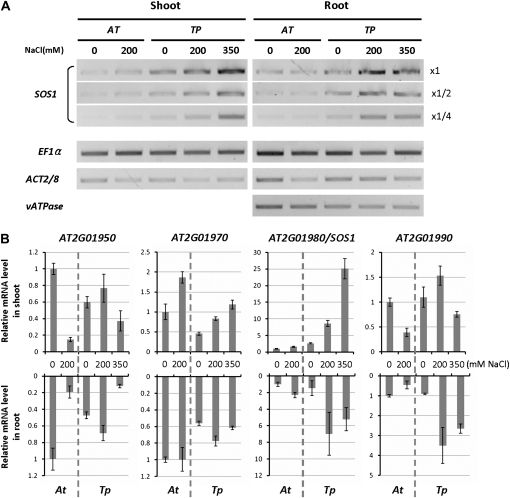
Figure 4.
Analysis of SOS1 mRNA abundance in Arabidopsis and T. parvula SOS1. SOS1 mRNA levels were compared between Arabidopsis and T. parvula with RT-PCR (A) and quantitative real-time PCR (B). In A, dilution series of cDNA were used for SOS1 to ensure that the reaction was performed in a linear range. In B, relative mRNA levels were normalized with EF1α as a reference. Fold differences compared with the nonstressed Arabidopsis sample are shown. Error bars indicate the sd from six repeats (two biological and three analytical repeats). Expression patterns of orthologous genes around SOS1 are shown for comparison.

