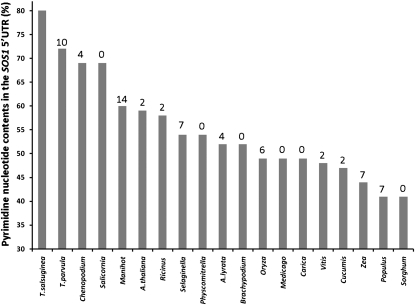
Figure 6.
Frequency of pyrimidine nucleotides in SOS1 5′ UTR sequences of diverse organisms. CT content values (%) are sorted from large to small, and the percentage difference between two consecutive columns is shown above each column. Additional sequences are Chenopodium quinoa (gi:154269387), Salicornia brachiata (gi:214028395), Populus trichocarpa gene POPTR_0010s11130, Manihot esculenta cassava39868.m1, Ricinus communis 29780.t000067, Medicago truncatula Medtr2g043140, Cucumis sativus Cucsa.026500, Arabidopsis lyrata SOS1, Oryza sativa LOC_Os12g44360, Carica papaya evm.TU.supercontig_2.63, Vitis vinifera gene GSVIVT00030673001, Sorghum bicolor Sb08g023290, Zea mays GRMZM2G098494, Brachypodium distachyon Bradi4g00290, Selaginella moellendorfii, Physcomitrella patens, and Chlamydomonas reinhardtii Au9.Cre24.g769600. One hundred nucleotides upstream of the translation start site was taken unless a shorter 5′ UTR was defined for a given species.

