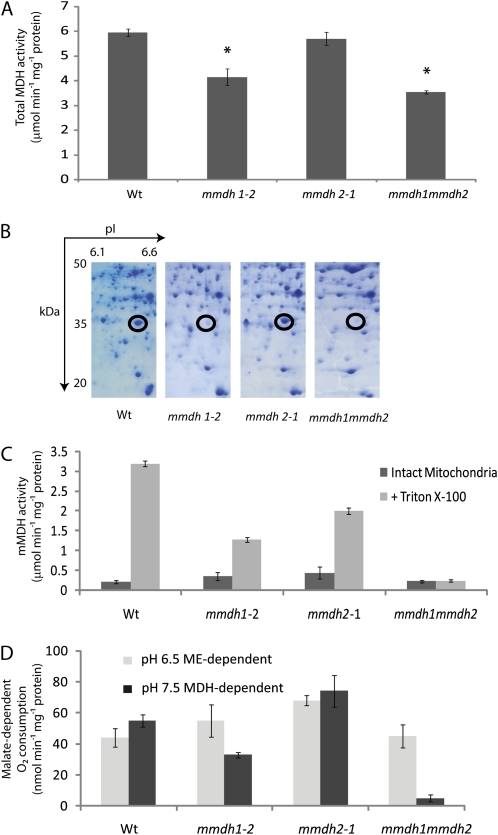
Figure 2.
mMDH protein abundance and activity are altered in mmdh knockout plants. A, Changes in total cellular MDH activity. Bars are means ± se (n = 4), and asterisks indicate significant differences (P < 0.05) from the wild type (Wt). B, Loss of mMDH1 on two-dimensional gels of mitochondrial proteins from mmdh1 and mmdh1mmdh2. C, Total MDH activity in isolated mitochondria, showing activity in intact mitochondria and activity after organelle rupture with Triton X-100. Bars are means ± se (n = 3). D, Malate-dependent respiratory rate of isolated intact mitochondria at pH 6.5 to maximize NAD-ME activity and at pH 7.5 to maximize MDH activity. Bars are means ± se (n = 3).

