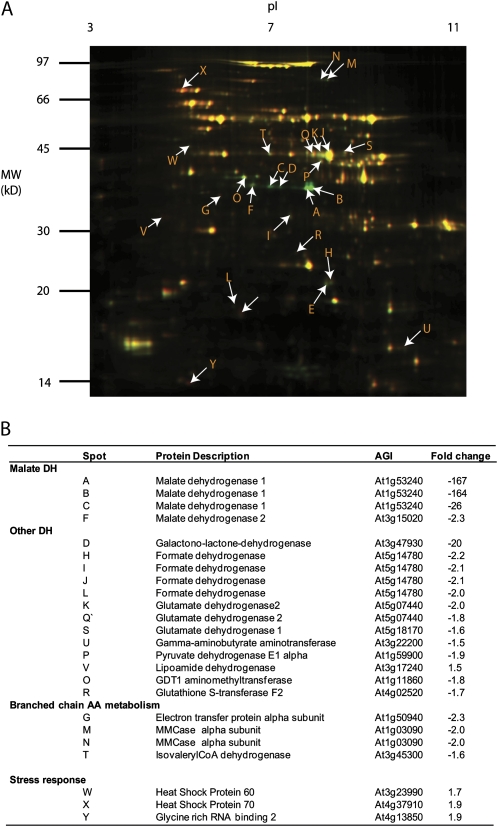
Figure 3.
Differential in-gel analysis of mitochondria shows compensatory changes in the mitochondrial proteome in mmdh1mmdh2. A, Overlay of fluorescence images of typical two-dimensional gels showing common proteins in yellow, protein decreased in mmdh1mmdh2 in green, and protein enhanced in mmdh1mmdh2 in red. B, Proteins identified from protein spots marked in A with fold changes (n = 3; P < 0.05). AGI, Arabidopsis Genome Initiative number.

