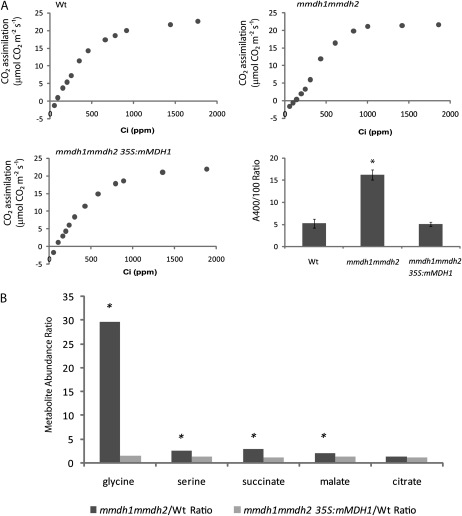
Figure 8.
Physiological and metabolite characterization of mmdh1mmdh2 complemented with mMDH. A, A/Ci curves of the wild type (Wt), mmdh1mmd2, and mmdh1mmdh2 35S:mMDH1 and A400/A100 ratios, where bars are mean ratios ± sd (n = 3). B, Metabolite ratios between the wild type and mmdh1mmdh2 and between the wild type and mmdh1mmdh2 35S:mMDH1 at 3 h into the day. Fold changes with significant differences (P < 0.05; n = 5) are indicated with asterisks. Plants were grown under short-day conditions.

