Figure 9.
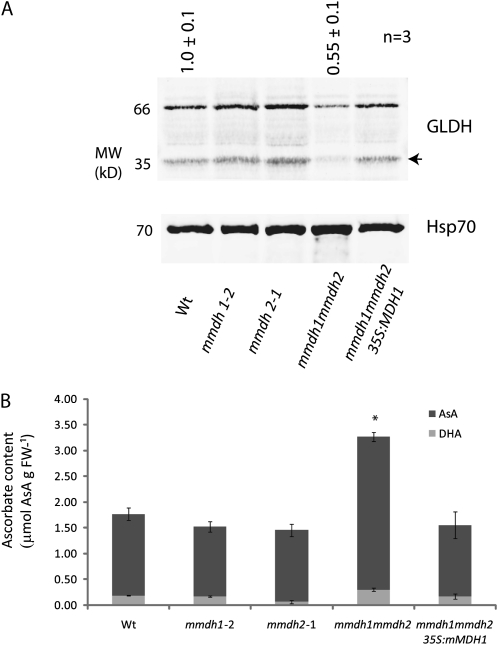
Change in GLDH protein amount and total cellular ascorbate levels in mmdh1mmdh2. A, Immunoreactivity of GLDH in different mutants on a mitochondrial protein basis. A representative gel is shown, and mean abundance of the immuonreactive band ± se is shown above the lanes (n = 3). The arrow indicates a truncated product of GLDH found in DIGE (Fig. 3) and also immunodetected. B, Reduced and oxidized ascorbate (AsA) content of leaf tissue. Bars are means ± se (n = 4), and asterisks indicate significant differences (P < 0.05) from the wild type. FW, Fresh weight; Wt, wild type. Plants were grown under short-day conditions.

