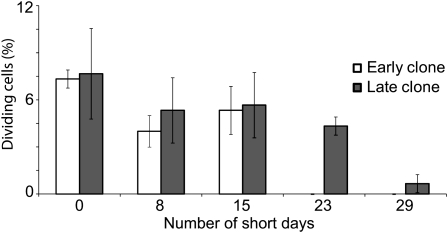
Figure 1.
Analysis of cambial cell division in the early and late hybrid poplar clones after SD treatment. The y axis represents the percentage of fusiform cells undergoing cell division, and the x axis represents the duration of the SD treatment in days. At least 300 fusiform cells were analyzed from three separate plants of the two clones at each time point, and data are expressed as the average of the three measurements with sd.

