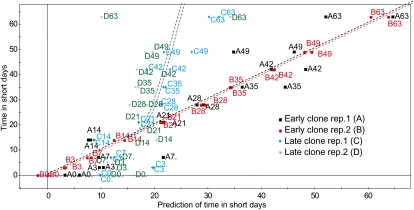
Figure 2.
Comparison of global changes in transcript abundance in the early and late hybrid poplar clones after SD treatment. PLS analysis was used to compare patterns of global changes in transcript levels in the early and late clones (see “Materials and Methods”). Samples A (black) and B (red) represent the two biological replicates from the early clone, and samples C (blue) and D (green) represent the two replicates from the late clone. The x axis represents the predicted duration of the SD treatment in days, and the y axis represents the observed (true) duration in days. For example, point A28 represents sample A from the early clone after 28 d of exposure to SDs.

