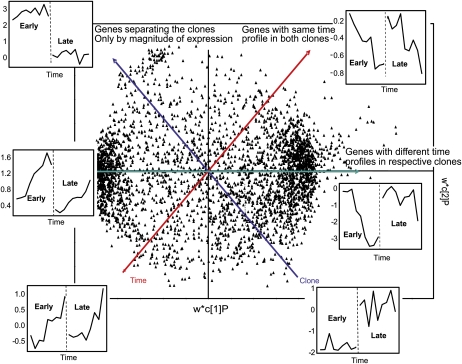
Figure 3.
Analysis of differences in global changes in transcript levels between the early and late hybrid poplar clones exposed to SDs using OPLS (see “Materials and Methods”). The green axis indicates which genes differ in their time profiles between the early and late clones. The red axis indicates which genes have similar time profiles in the two clones. The blue axis indicates which genes differ only in their magnitude of transcript levels between the two clones.

