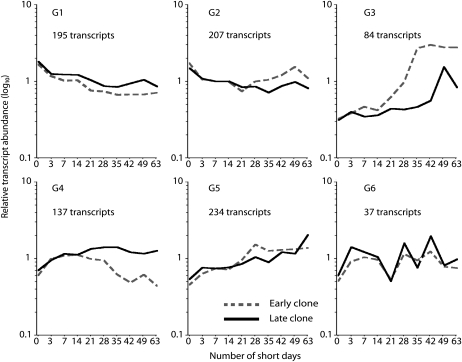
Figure 4.
Comparisons of the expression patterns of 894 transcripts (Supplemental Table S2) whose levels changed significantly in both hybrid poplar clones after SD treatment. The expression patterns were clustered using the K-means method. The number of transcripts and mean expression profile are shown for each cluster. The nonlinear x axis represents the duration of the SD treatment in days, and the y axis represents relative transcript levels expressed as a ratio (log10 scale).

