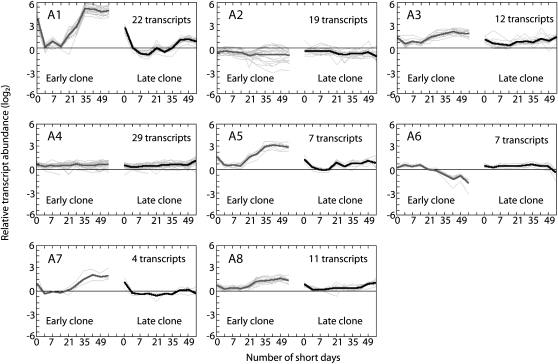
Figure 5.
Comparisons of the patterns of auxin-responsive genes in the early and late hybrid poplar clones after SD treatment. Expression patterns of the 111 auxin-responsive transcripts whose expression changed significantly in both the early and late clones (Supplemental Table S3) were clustered using the K-means method. The nonlinear x axis represents the duration of the SD treatment in days, and the y axis represents relative transcript levels expressed as a ratio (log2 scale). The number of transcripts and mean expression profile are shown for each cluster.

