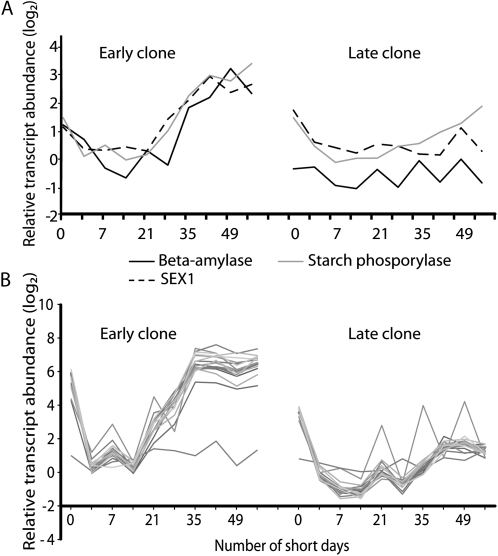
Figure 7.
Analysis of transcripts associated with starch breakdown (A; Supplemental Table S1) and bark storage proteins (B; Supplemental Table S5) in the early and late hybrid poplar clones following SD treatment. The nonlinear x axis represents the duration of the SD treatment in days, and the y axis represents the relative gene expression expressed as a ratio (log2 scale).

