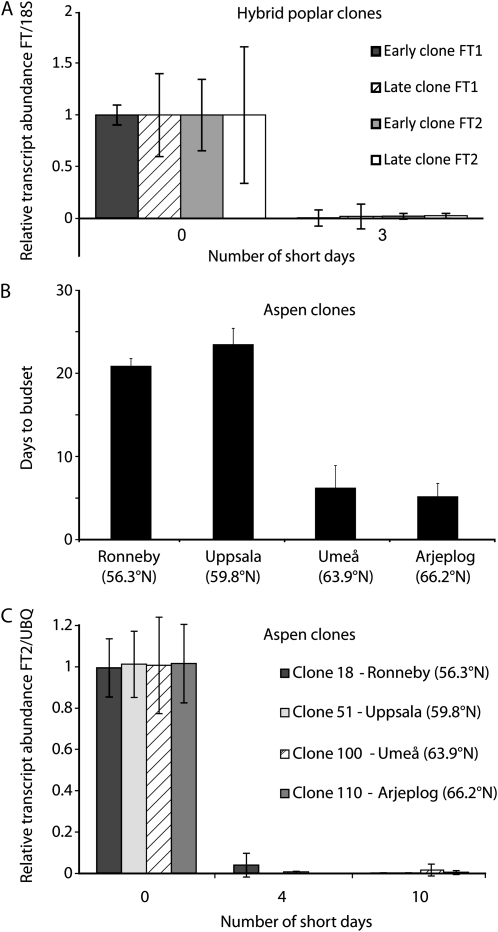
Figure 8.
A, SD regulation of FT1 and FT2 in the early and late hybrid poplar clones. The x axis represents the duration of the SD treatment in days, and the y axis indicates gene expression relative to the 18S rRNA control. B, Induction of growth cessation in Swedish aspen clones. The x axis shows the aspen clones used (for detailed descriptions, see “Materials and Methods”), and the y axis represents the duration of the SD treatment in days. C, SD regulation of FT2 in aspen clones. The x axis represents the duration of the SD treatment in days, and the y axis represents gene expression relative to the Ubiquitin (UBQ) control.

