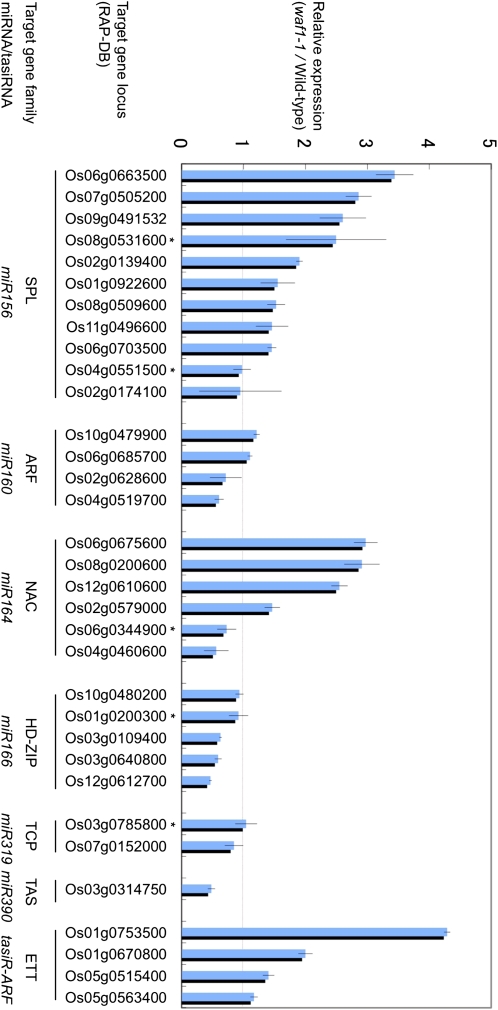
Figure 7.
Expression changes of miRNA/ta-siRNA putative targets in the seven gene families in waf1-1 revealed by the Affymetrix GeneChip rice genome array. Vertical bars indicate expression levels of waf1-1 relative to that of the wild type. Their Rice Annotation Project Database (RAP-DB) locus, target gene family, and miRNA/ta-siRNA are indicated. Error bars indicate sd. A RAP locus with an asterisk is not verified by the degradome data as a miRNA target (Li et al., 2010). [See online article for color version of this figure.]

