Figure 1.
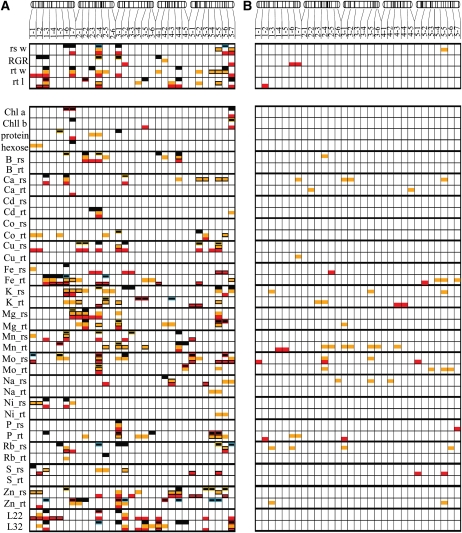
QTL mapping for growth-related traits (rosette weight [rs w], RGR, root weight [rt w], and root length [rt l]), for chlorophyll (Chla, Chlb), protein, hexose, and ionomic traits, and for leaf number (at day 22 [L22] and day 32 [L32]). The five chromosomes of Arabidopsis are presented above each panel (chromosomes 1 to 5 from left to right). The genetic positions of the markers that were used to elaborate the genetic map are reported by vertical bars on each chromosome. The ionomic traits are represented by their element abbreviations, and the examined tissues are the rosette (_rs) and the root (_rt). The chromosomes were divided into bins of 15 cM (for more detailed characterization of these QTLs, see Supplemental Table S1). A, QTL detection for the traits quantified in the C (black boxes), K− (orange boxes), and P− (red boxes) hydroponic solutions. For each trait, the QTL models obtained in each condition were tested in the other conditions, and significant QTL × E interactions are shown (see “Materials and Methods”). For the QTLs detected in the control condition, orange and red rims around the QTL boxes indicate that a significantly different effect was detected between C and K− and between C and P− conditions, respectively. QTLs reported with blue rims indicate that a significantly different effect of this QTL was found between C and both K− and P− conditions. For the QTLs detected in the K− or P− conditions, black rims indicate a significantly different effect of this QTL when compared with the control condition. B, QTL detection for trait responses to the K− (orange) and P− (red) regimes.

