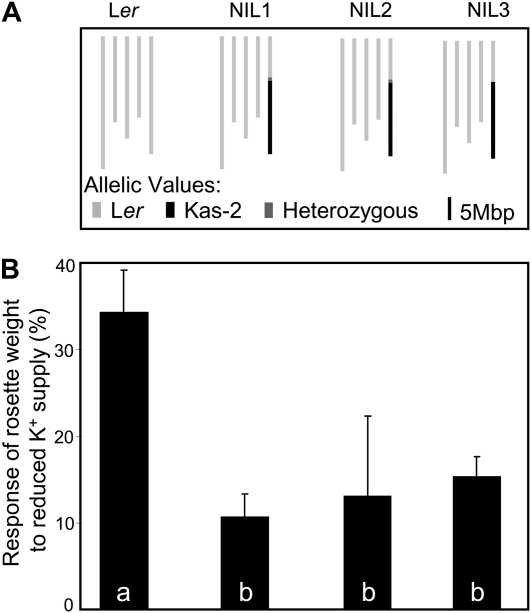
Figure 2.
Validation of the rosette weight response QTL for the K− regime. A, Graphic representation of the genotypes of Ler and the selected NILs carrying an introgression of Kas-2 alleles on the bottom of chromosome 5 (for detailed genotyping, see Supplemental Fig. S3). B, Response of rosette weight to lowered potassium supply for the lines represented in A (mean ± se; n = 3 experiments). Values with differing letters are significantly different at P < 0.05.

