Figure 2.
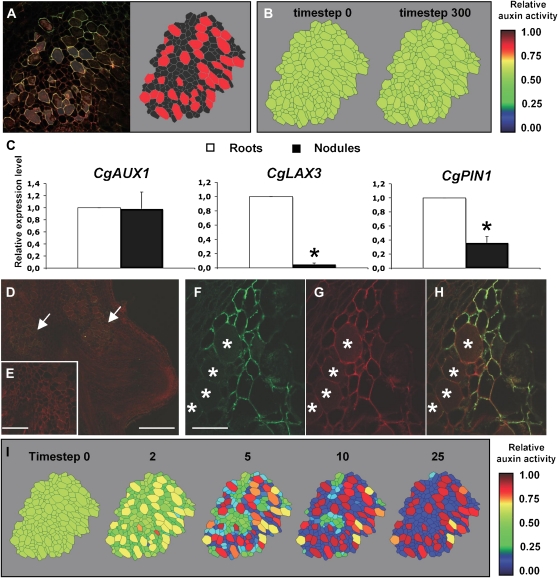
Expression of auxin transporters in C. glauca nodules is sufficient to predict an auxin accumulation in Frankia-infected cells. A, Example of digitization of nodule tissue. Confocal microscopy images of nodule tissue autofluorescence (left section) were used as a base for manual digitization of the geometry in a virtual representation of the nodule (right section, see also Supplemental Fig. S1). Information regarding the infection of the cells was added in the virtual tissue (infected cells here denoted in red). B, Distribution of auxin in a virtual nodule with infected cells expressing CgAUX1, starting from a uniform auxin level. Infected cells accumulate auxin very slowly in this condition (see Supplemental Fig. S2 for other virtual nodules and starting auxin distribution). Auxin activity is the relative auxin concentration within the cells and its representation is capped at value 1. C, Expression of CgAUX1, CgLAX3, and CgPIN1 in C. glauca uninfected roots and nodules harvested 3 weeks after inoculation. RNA abundance was determined by qRT-PCR and presented are means ± sd of three independent experiments. *P < 0.05, Statistical randomization test (Rest 2009 software; Qiagen). D to H, Immunolocalization of PIN1-like proteins in C. glauca nodules. D, PIN1-like proteins are detected (arrows) close to the nodule apex, i.e. in the region close to the meristem. E, No signal was detected in control immunolocalization experiments without the PIN1. F to H, Close-up in the apex of a C. glauca nodule showing the signal corresponding to the PIN1 antibody (F), autofluorescence (G), and the merged image (H). Infected cells are marked with asterisks. I, Evolution of the distribution of auxin in a virtual nodule with infected cells expressing CgAUX1 and noninfected cells expressing CgPIN1, starting from a uniform auxin level. Auxin activity is the relative auxin concentration within the cells and its representation is capped at value 1. The generated auxin distribution was shown to be robust to CgPIN1 perturbation (see Supplemental Fig. S4). Scale bars: 250 μm (D), 100 μm (E), and 50 μm (F–H).

