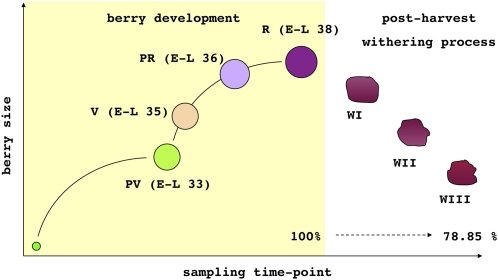
Figure 1.
The seven sampling time points covering berry development and withering. The first four sampling time points encompass berry development, whereas the last three encompass the 3-month postharvest withering process. The weight loss during withering is indicated by the weight as a percentage of the weight during ripening. PV, Preveraison; V, veraison; PR, preripening; R, ripening; WI, withering I; WII, withering II; WIII, withering III. Each time point is also represented according to the modified E-L system for grapevine growth stages defined by Coombe (1995). [See online article for color version of this figure.]

