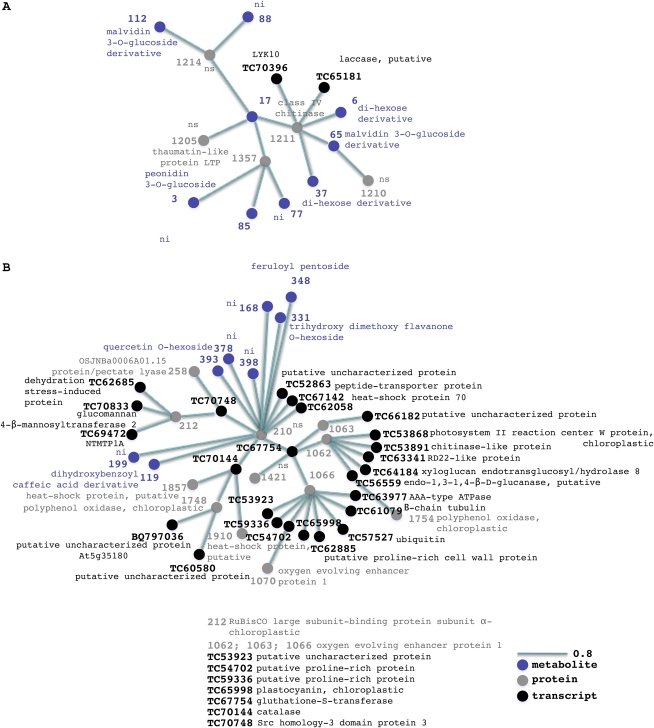
Figure 8.
Transcript-protein-metabolite networks. A network representation of the two transcript-protein-metabolite clusters generated by HCA performed on selected transcript, protein, and metabolite variables from O2PLS-DA data is shown. The length of the variable interconnection is inversely proportional to the pair-wise correlation between the two variables. Black, transcript; gray, protein; violet, metabolite; nhf, no hits found; ni, not identified; ns, not sequenced. [See online article for color version of this figure.]

