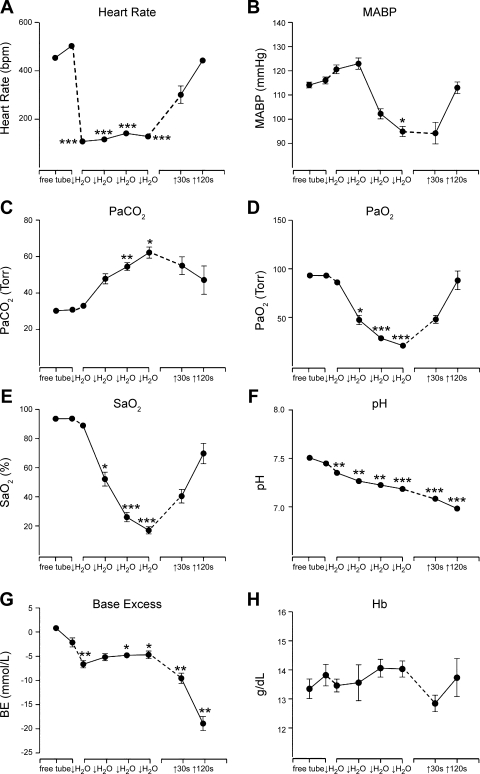
Fig. 2.
Line graphs illustrating the mean changes in hemodynamics and blood chemistry during prolonged underwater submersion. A: there was a dramatic bradycardia with submersion, which persisted while the rat was underwater. B: there also was a slight increase in mean ABP (MABP) initially, but pressure fell during later stages of submersion before rising to control levels after the rat emerged and started breathing. PaCO2 rose dramatically (C), while PaO2 (D) and arterial oxygen saturation (SaO2; E) fell sharply in the rats while underwater, reaching levels at which most mammals are induced to breathe. The blood also quickly became very acidotic (F) with great loss of base excess (BE; G). H: hemoglobin (Hb) fluctuated nonsignificantly during the period of underwater submersion and afterwards. The first point represents data from rats free in their home cage, while the second data point is after their enclosure in the restraining tube. Dashed lines mark time either just before submersion or out of the water. The four middle data points represent time underwater; each slash marks ∼20 s. Points without error bars represent very small standard errors. *P ≤ 0.05, **P ≤ 0.01, ***P ≤ 0.001.

