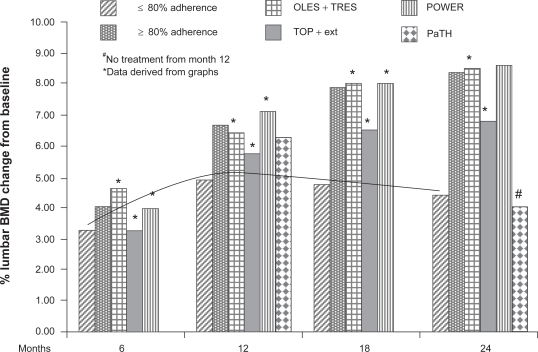
Figure 3.
Comparison of percentage changes in lumbar spine BMD in patients treated with PTH (1-84) in the TOP, OLES, POWER and PaTH studies, and reanalysis of data for highly compliant patients. The line shows that the trend of noncompliant patients of all the other studies. A different trend is also seen for patients that stopped PTH treatment after 12 in the PaTH study.

