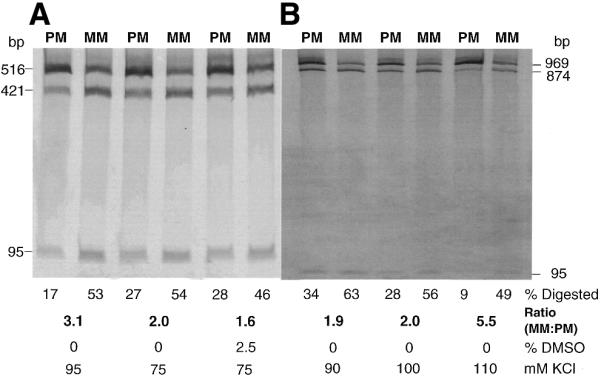
Figure 3.

Optimization of PCR–CRMS with longer targets amplified from the CDKN1A locus. The assay conditions were further optimized to accommodate the 516 bp (A) and 969 bp (B) PCR products. Optimal conditions were predicted using the Taguchi method. Homozygous (PM) and heterozygous samples (MM) were used as negative and positive controls, respectively. Product digestion is quantitated as the percentage of the fragment cleaved relative to input. MM:PM, a measure of signal to noise, represents the ratio of the heterozygous fraction digested to the homozygous fraction digested. Also shown below are the final concentrations of DMSO (%) and KCl (mM) added to the reaction.
