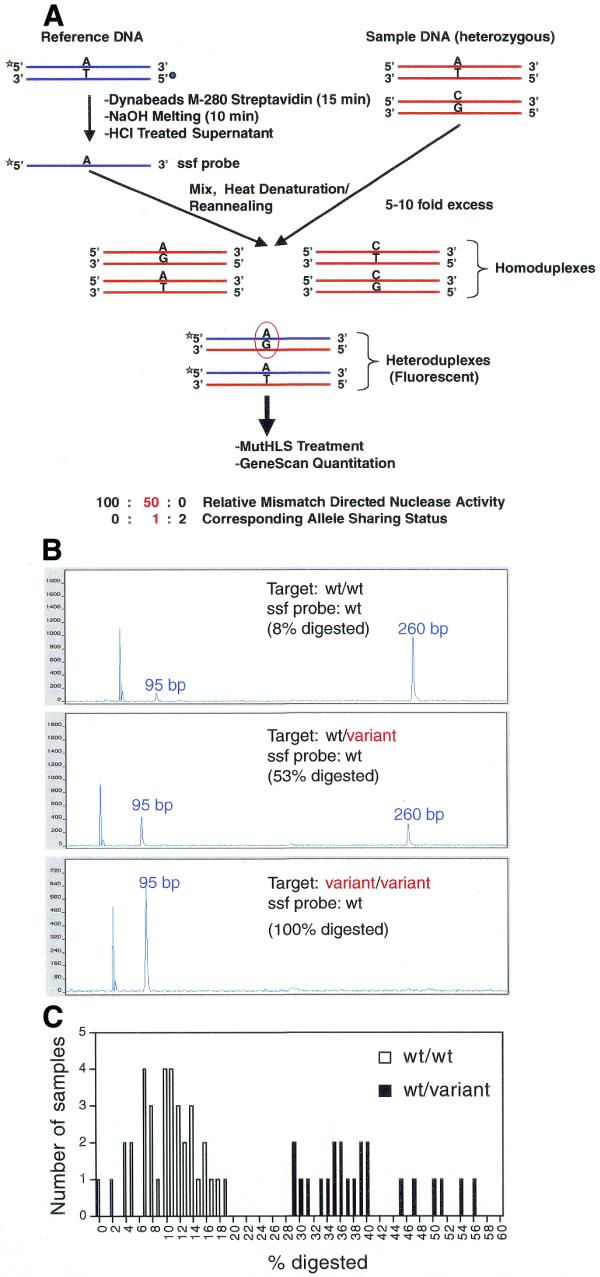
Figure 7.

PCR–CRMS genotyping mode. (A) Schematic representation of the PCR–CRMS strategy employing ssf probe. A target locus of interest is PCR amplified with standard primers (red strands). A reference probe is also amplified using a fluorescence-labeled forward primer and a biotin-tagged reverse primer. Following purification of single-strand, labeled reference probe by streptavidin binding, the ssf probe (dark blue strands) is mixed with the test sample PCR products in a ratio of 1:5 to 1:10. The solution is heat denatured and reannealed in assay buffer. The fluorescent heteroduplexes thus formed are the targets of PCR–CRMS and are the only duplexes detected using the ABI 377 automatic sequencer, forced to hybridize with the minus strand of the unknown sample forming heteroduplexes. Quantitative analysis of the electropherogram (GeneScan) provides the extent of mismatch-directed cleavage; in genotyping mode this corresponds to allele-sharing status. The green and blue circles represent the fluorescent label and biotin tag, respectively. (B) Three typical electropherograms of PCR–CRMS products representing the ratios of PCR–CRMS products obtained with a wild-type ssf probe and three types of genotypes following electrophoresis on the ABI 377 automatic sequencer. Upper, homozygous wild-type DNA (wt/wt); middle, heterozygous wild-type/variant DNA (wt/variant); lower, homozygous variant DNA (variant/variant). Percent cleavage for each reaction is provided in each panel. (C) Frequency distribution of the percent digestion data obtained from a blind PCR–CRMS assay performed on 58 previously genotyped DNAs. The ssf probe was wild-type. The open and solid bars represent samples previously genotyped as homozygotes and heterozygotes, respectively.
