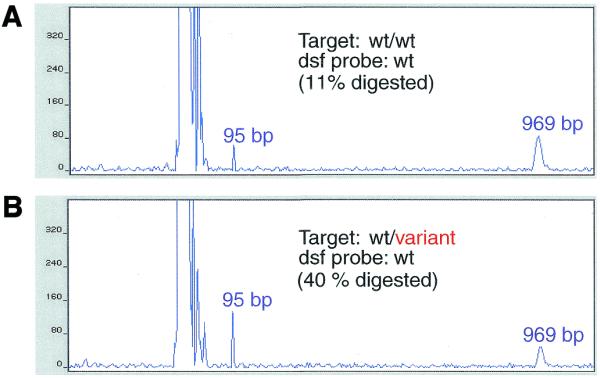
Figure 8.

Direct comparison of two sample DNAs (dsf probe). A 969 bp target region from CDKN1A (see Fig. 1) was PCR amplified from DNA of several individuals with known genotypes. Amplification in one case employed a fluorescence-labeled primer; the other DNAs were amplified with standard primers. The dsf probe for a wild-type homozygote, without further purification, was denatured and reannealed in the presence of a 30-fold excess of unlabeled PCR product from a wild-type homozygote (A) or a wild-type/variant heterozygote (B). The electropherograms depict the input sample (969 bp), cleavage fragment (95 bp) and a large excess of unincorporated, labeled primer to the left of the 95 bp peak. Percent cleavage for each reaction is also provided in each panel.
