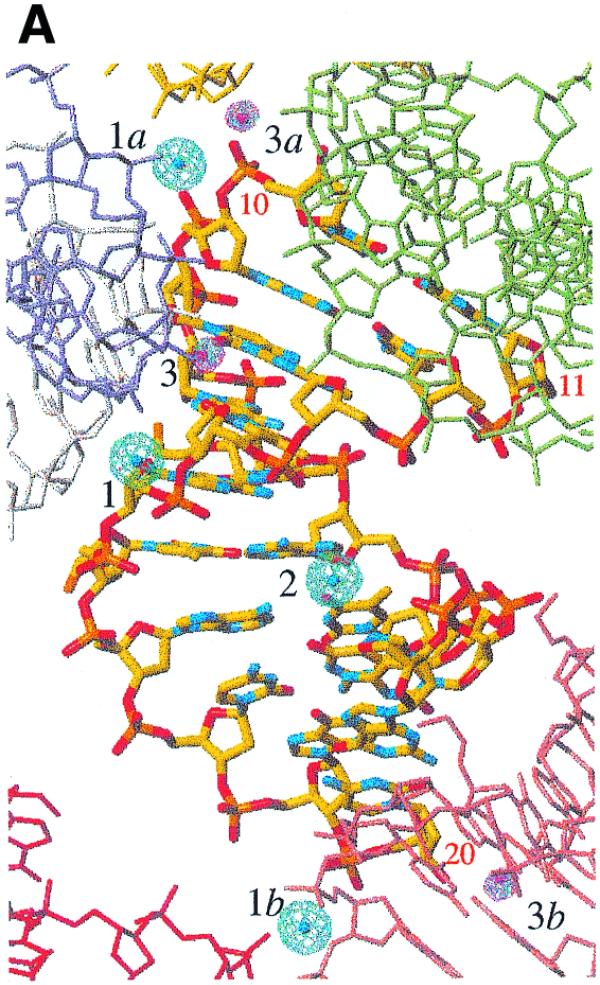
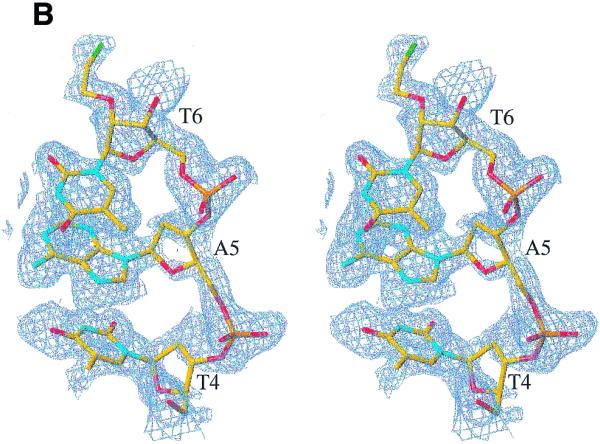
Figure 2.


Maps calculated at 1.8 Å resolution with SAD phases for the Rb-FET structure and superimposed on the final structure (selected DNA residues are numbered). (A) The anomalous difference Fourier (blue) and double-difference (red) maps contoured at the 4σ level. Ion-binding sites 1 and 2 (shown with their symmetry mates, designated by lower case letters) were located in the anomalous difference Patterson map and used for phasing. Ion-binding site 3 was found at this stage and is characterized by a significantly greater peak height than the remaining peaks in the double-difference density map. (B) Stereo diagram of the density-modified electron density map contoured at the 1σ level and superimposed on the central TAT portion of the structure. DNA atoms are colored yellow, red, cyan, orange and green for carbon, oxygen, nitrogen, phosphorus and fluorine, respectively. Electron density for the FET substituent of T6 is clearly visible in this map.
