
Figure 7.
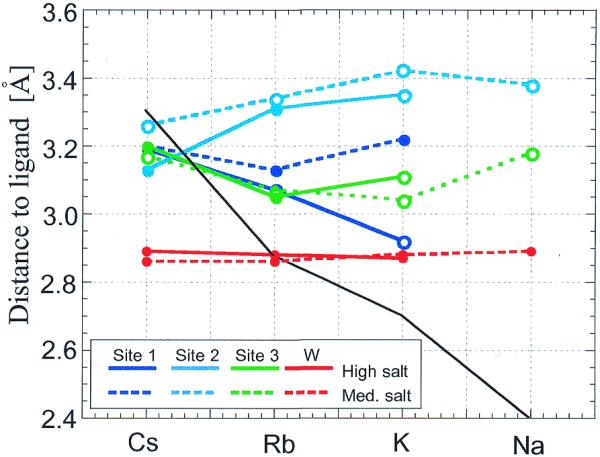
Average distances between alkali metal ions and oxygen atoms (DNA or water) plotted as a function of ion type for high and medium salt concentrations. The black solid line indicates ideal coordination distances for individual alkali metal ions. Open circles indicate coordination spheres that lack water molecules compared with fully occupied sites (high salt Cs-MEP and Rb-FET; see Tables S2–S4).