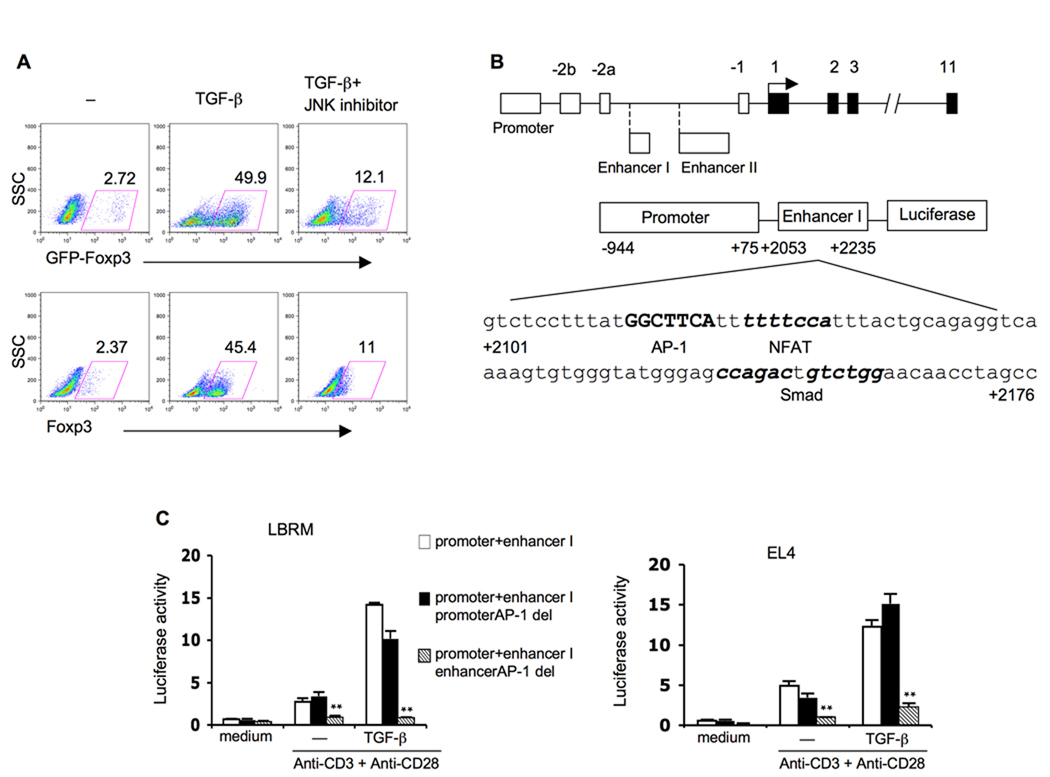
Figure 1. AP-1 site located in a Foxp3 enhancer region plays positive role on TCR/TGF-β induced Foxp3 gene expression.
(A) Murine CD4+ T cells from Foxp3-GFP mice were stimulated with plate bound anti-CD3 (10µg/ml), soluble anti-CD28 (2µg/ml) and TGF-β (5ng/ml) with or without JNK inhibitor (10µM) for 5 days then collected for flow cytometry analysis.
(B) Schematic diagram of Foxp3 gene (upper) and AP-1: NFAT and Smad3 sites in Foxp3 enhancer I region (lower).
(C) Two different murine T cell lines LBRM (left) and EL4 (right) were transfected with Foxp3 promoter and enhancer I reporter construct (promoter+enhancer I) or the reporter construct with promoter AP-1 site deletion (promoter+enhancer I promoter AP-1 del) or the reporter construct with enhancer I AP-1 site deletion (promoter+enhancer I enhancer AP-1 del). Four hours later cells were split and stimulated with plate bound anti-CD3 (10µg/ml), soluble anti-CD28 (2µg/ml) with or without TGF-β (2ng/ml). Luciferase activity was measured 24 hours later and values were shown as the ratio of firefly luciferase activity/Renilla luciferase activity from the same well. Data represent four independent experiments. **p<0.01, compared to intact construct under same stimulation conditions.

