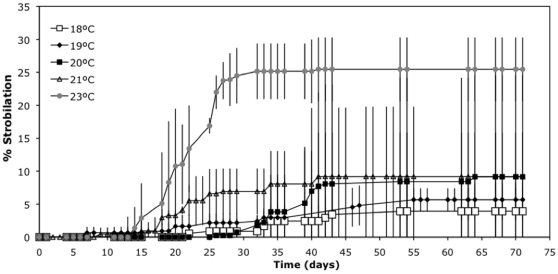
Figure 6. Triggering of strobilation by an increase in temperature (Experiment G).
Cumulative percentage of polyp strobilation during a change of temperature from 17.5°C to 18, 19, 20, 21 and 23°C. Previously polyps were at 17.5°C for 5 months. The x-axis is the time (days) after the increment of temperature. Error bars are the standard deviation of the three replicates'.

