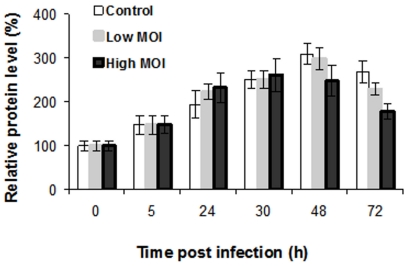
Figure 3. Total level of cellular proteins in RVFV-infected HSAECs.
Slides stained with Sypro Ruby and normalized relative to uninfected HSAECs at 0 h.p.i. Each sample of 40 cells per dot along with seven 2× serial dilutions was printed in duplicate. Black and gray bars illustrate the MOI of 0.002 and 0.0002, correspondingly. Data represent mean values and confidence intervals of two-tail t-test (α = 0.05, n = 3).

