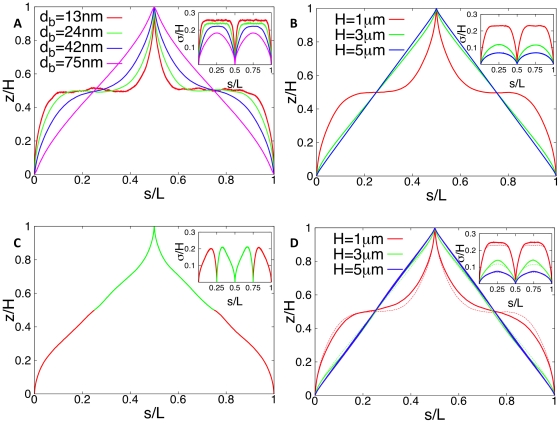
Figure 6. Average subcellular position of genes as function of their position on the chromosome in newborn E. coli cells as obtained from numerical simulations of compacted DNA.
The figure shows the z-position of an average chromosome configuration as function of the contour length s. In our model a chain of blobs represents the compacted DNA. The position on the chromosome is parameterized by s (measured in units of DNA length L). In figures A, B, and D ori and ter are positioned at the cell poles ( and
and  ). The configurations shown in figure A are for a cellular volume of
  and different blob diameters by assuming a constant density of DNA of
  per blob. The dependence on the volume at constant DNA density is shown in figure B. Cell shapes are varied at constant cross section but different length
  (corresponding to H = 33…165 blobs). The largest newborn cell has a volume of
  . Figure C shows a DNA configuration in a cell with two chromosomes (shown in different colors) just prior to cell division. The two ori have fixed positions at the cell poles, the two ter are kept at midcell. The contour length is measured along the path left (chromosome #1)-right (chromosome #2)-left (chromosome #2)-right (chromosome #1). Data shown are for a volume of
  and each chromosome is represented by 2000 blobs. In this way the cellular DNA density remains constant and that the length of compacted DNA per blob (given by
  DNA per blob) is independent of the volume. A DNA configuration in these faster growing cells at an earlier stage of the cell cycle is shown in figure D. Here, the cell contains an additional DNA strand whose ends are anchored in the midplane of the cell mimicking the geometry of the chromosome after half the replication time [when the replication forks are located at 3 o'clock and 9 o'clock on the mother chromosome (solid lines)]. The presence of additional DNA makes the linear correlation stronger. For comparison the DNA configurations without daughter DNA are shown (dashed lines). Parameter values are as in figure B. The insets show the (rescaled) standard deviations from the mean configurations as function of s.

