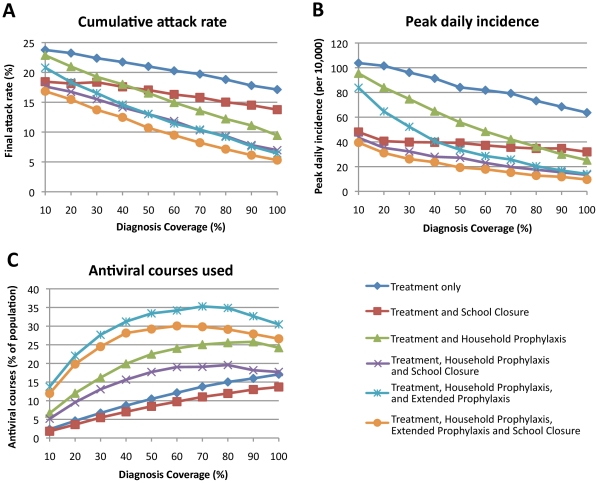
Figure 3. Outcome of six antiviral intervention strategies as a function of diagnosis coverage.
Three outcomes are reported: (A) cumulative illness attack rate, (B) peak daily incidence (per 10,000 population), and (C) number of antiviral courses used as a percentage of the population size. We simulated percentages of symptomatic individuals being diagnosed ranging from 10% to 100% in 10% increments. We assumed that the delay between symptoms appearing and antiviral treatment or treatment plus prophylaxis was 24 hours.

