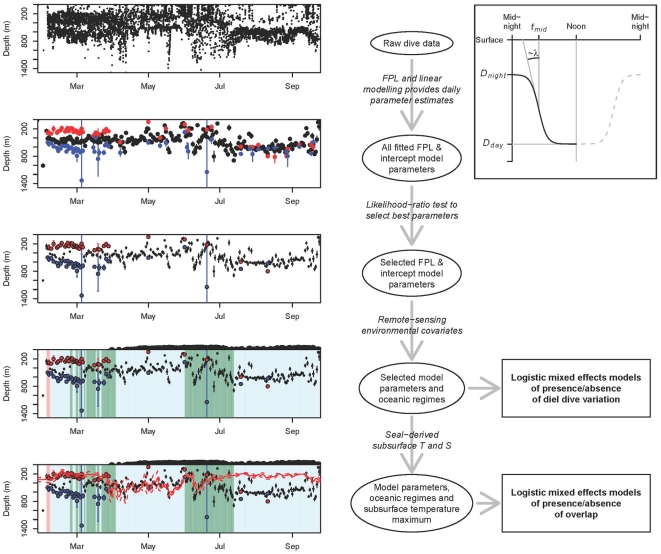
Figure 3. Schematic flow-chart of the analytical approach.
The strip-charts in the left column represent time vs depth (cf. Fig. 6). The top figure shows the raw data for maximum depth reached during individual dives throughout the sampling record of one seal and subsequent strip-charts illustrate the output of applying the successive procedures indicated in italics in the middle column. The inset (top right-hand) illustrates the parameters of the four-parameter logistic model of diving depth as a function of time of day, as defined in Eq. 1. The λ symbol indicates that the maximum slope of the curve is determined by the λ parameter. The two squares (bottom right-hand) represent the two series of final logistic mixed effects models testing for relationships between dive patterns and environmental covariates.

