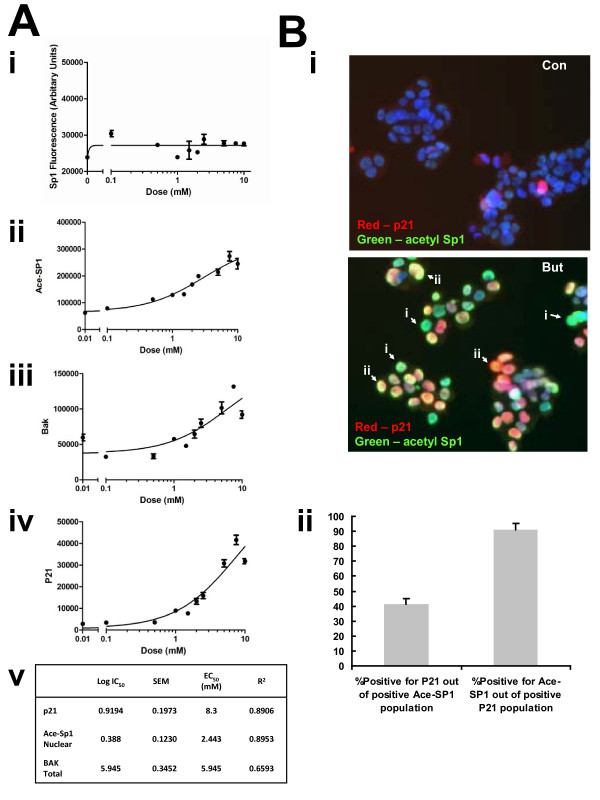
Figure 1.
Sp1 acetylation increases in a co-linear manner with bak and p21 expression following sodium butyrate treatment. HCT116 cells were treated with increasing concentrations of butyrate (0-20 mM) for 24 hr, fixed and fluorescence immunostained either for Sp1 and Bak or Ace-Sp1 and p21. Cellular fluorescence was quantified by High-Content Analysis. Panel A shows protein expression levels of Sp1 (Panel Ai); acetyl-Sp1 (Panel Aii); Bak, (Panel Aiii) and p21 (Panel Aiv). Data are from a single pass experiment with three replicates, with 50 fields per replicate scored. The EC50 value for each event in response to butyrate is shown in Panel Av. Panel B shows representative images of HCT116 cells following 24 h of 0 or 10 mM sodium butyrate treatment and fluorescence immunostaining for acetyl-Sp1 and p21. Panel Bi shows representative fields from the control (untreated) cells (upper panel) and the treated culture (lower panel). Staining patterns in the treated cells broadly fell into two main types, cell positive for acetyl-Sp1 alone (examples marked by arrows i) and cells positive staining for both acetyl Sp1 and p21 (marked by arrows ii). These subpopulations were distinguished by plotting acetyl-Sp1 vs. p21 fluorescence (see supplementary online data Fig 2 for gating strategy). Panel Bii shows quantitation of data from three independent experiments, showing numbers of cells in gated fractions that were dual stained, as indicated.

