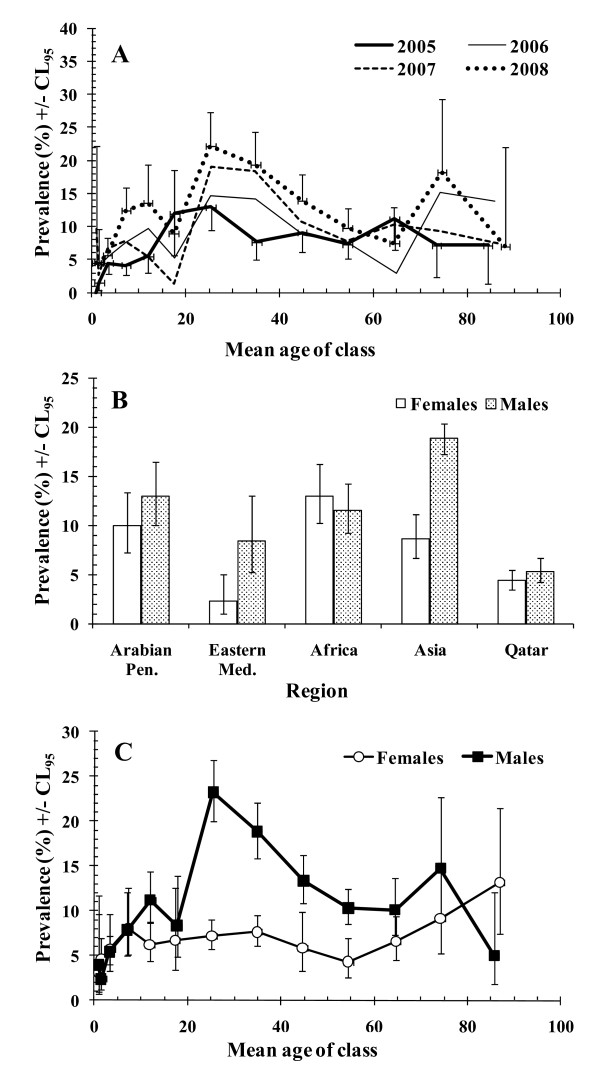
Figure 1.
Factors affecting the prevalence of all parasitic infections combined. The significant terms in the minimum sufficient model are illustrated in (A-C) and the statistical significance is presented in the text. The model also included two expressions which did not encompass presence/absence of parasites and these are not given. For the goodness of fit of the minimum sufficient model, the likelihood ratio χ2786 = 746.5 (P = 0.84). A. Changes in prevalence by age class and year of study. The number of subjects in each age class varied from 22 - 402 and see Table 1 for further details. The 95% confidence limits are only shown on two data-sets to give an idea of the range and to avoid obscuring the data. B. Effect of sex on prevalence across the 4 regions from which immigrant workers originated and native Qataris. The number of subject in each group was as follows from left to right for females = 500, 271, 833, 396, 1881 and for males 799, 240, 2381, 478, 1429. C. Prevalence of infection in both sexes by age class. The number of subjects in each age class varied from 53 - 516 among females and from 60 - 861 among males.

