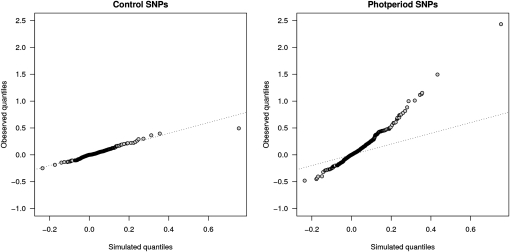
Figure 3.—
Quantile–quantile plots of the distributions of covariance of allelic effects for pairs of control SNPs or photoperiod SNPs against simulated data. Data for the control SNPs show a good correspondence with the simulated data whereas the photoperiod SNPs show an excess of pairs with unusually large positive or negative covariances of allelic effects.

