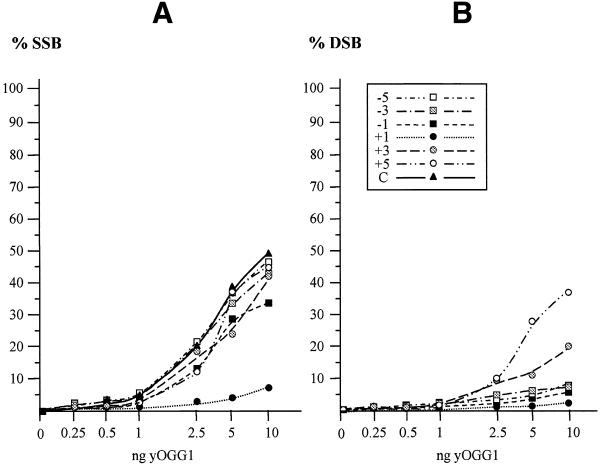
Figure 6.
Comparison of SSB and DSB formation by yOGG1 using oligonucleotides containing an AP site opposite to 8-oxoG. Increasing amounts of yOGG1 (0.5–10 ng) were incubated with an oligonucleotide containing an 8-oxoG on the labelled strand and an AP site at various positions on the opposite strand. The reaction conditions were as described in Figure 2A; half of the sample migrated on a 12% denaturing polyacrylamide gel to measure the percentage of SSBs (A) and the other half separated on a 10% native polyacrylamide gel to determine the level of DSBs induces by yOGG1 (B). The curves –5 to +5 represent the different positions of the β–δ-SSB relative to 8-oxoG as described in Table 1, curve C represents the control DNA containing 8-oxoG opposite the normal complementary strand.

