
Figure 3.
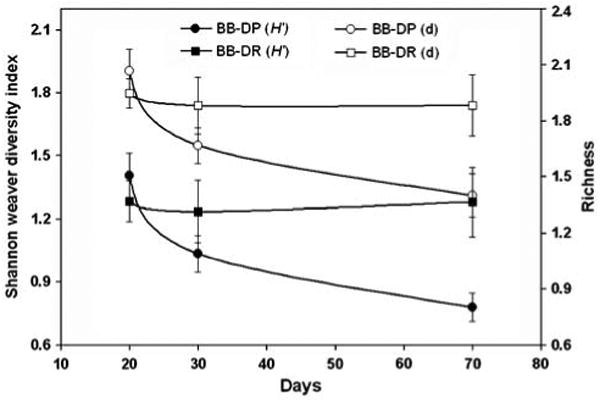
Shannon–Weaver and richness diversity indices calculated for the three time points after birth when stool was collected. Circles and squares represent the BB-DP and BB-DR samples, respectively. Open symbols represent the richness index (d) whereas closed symbols depict the Shannon–Weaver (H′) indices. Indices were calculated using automated ribosomal intergenic spacer analysis (ARISA) data from the experiment 2 samples.